Introduction to CoinTools
CoinTools is chrome extension that provides a few useful tools and graphs for crytocurrency.
Previous Contributions
- v0.0.6: CoinTools Update: Show Full Cryptocurrency Details by Click or Startup, Add Language Handlers
- CoinTools v0.0.5 Update: Show Full Cryptocurrency Details by Click or Startup, Add Language Handlers
- CoinTools v0.0.4: Conversion Between Two Fiat or Fiat-Coin + 24 Hour Cap Chart
- CoinTools v0.0.3: Adding Total Market Cap USD Chart, Localization and Stock Price Emoji
- v0.0.2 Cryptocurrency Conversion + UI Localization
- v0.0.1 Introduction to CoinTools! A Cryptocurrency Chrome Extension
Technology Stacks
Javascript that runs in Chrome Extension.
Github of CoinTools
https://github.com/DoctorLai/CoinTools
Chrome Webstore
It is available online at Chrome Webstore.
CoinTools v0.0.7 Feature
Along with some added language translation, this version adds the tab of History Data so that you can view 30 days historical conversion between any two cryptocurrency or fiat currency.
History conversion between cryptocurrency and cryptocurrency
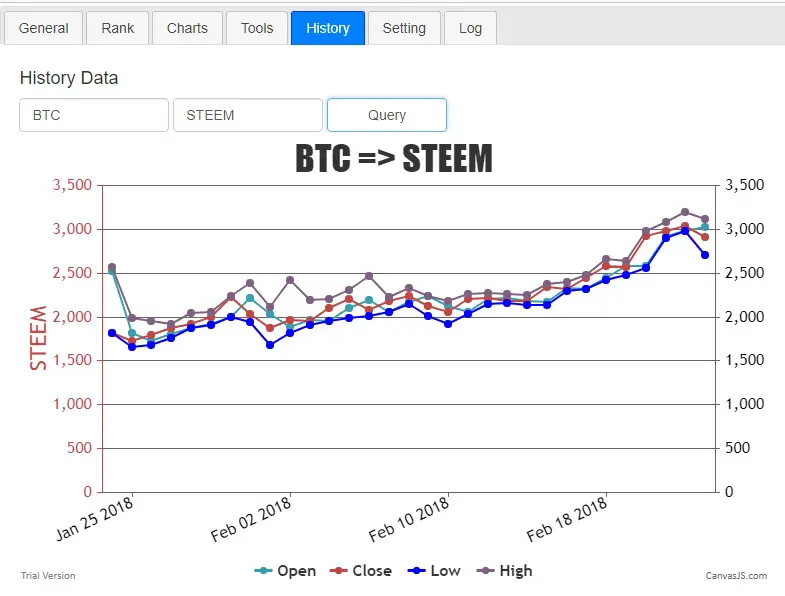
History conversion between cryptocurrency and cryptocurrency
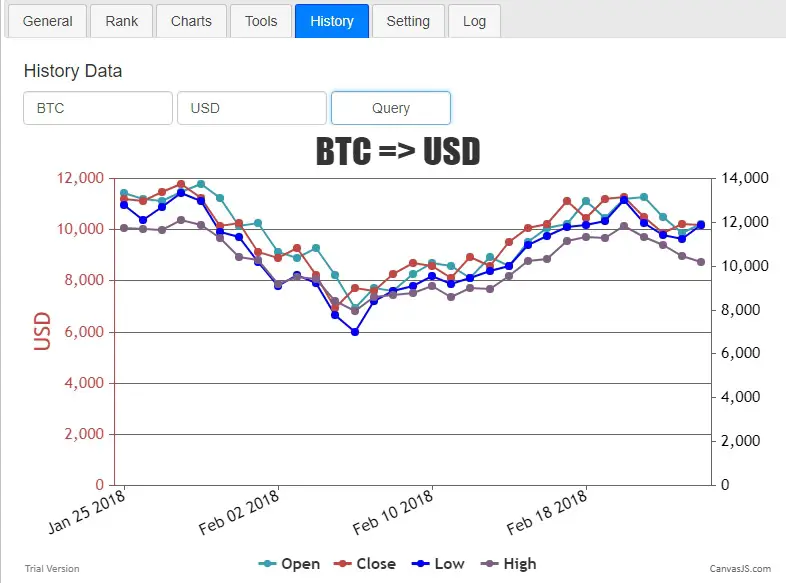
History conversion between cryptocurrency and fiat
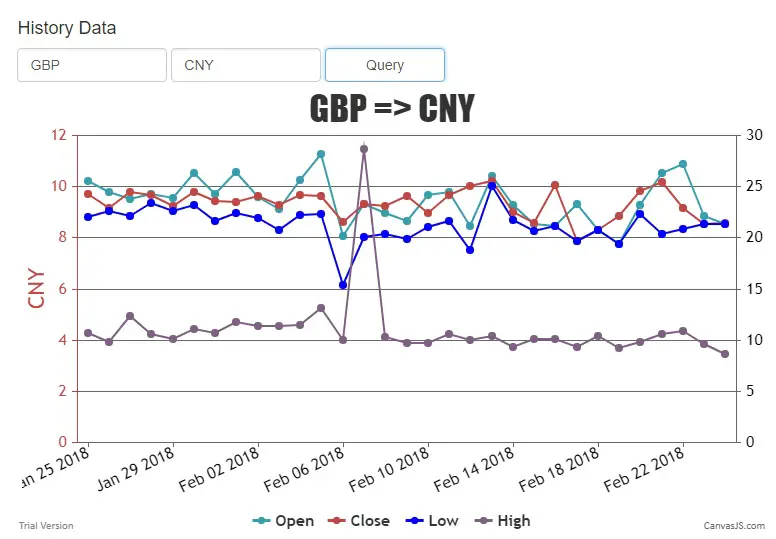
History conversion between fiat and fiat
Commits
Roadmap of CoinTools
- real-time graphs
- search cryptocurrency
- historical data
Javascript to handle conversion
// get history
const getHistory = (a, b, dom) => {
    let api = "https://min-api.cryptocompare.com/data/histoday?fsym=" + a + "&tsym=" + b + "&limit=30&e=CCCAGG";
    logit("calling " + api);
    dom.html('<img src="images/loading.gif" />');
    $.ajax({
        type: "GET",
        url: api,
        success: function(data) {
            if (data && data.Data && data.Response == 'Success') {
                let data_open = [];
                let data_close = [];
                let data_high = [];
                let data_low = [];
                let arr = data.Data;
                let datalen = arr.length;
                for (let i = 0; i < datalen; ++ i) {
                    let date = new Date(arr[i].time * 1000);
                    data_open.push({x: date, y: arr[i].open});
                    data_close.push({x: date, y: arr[i].close});
                    data_high.push({x: date, y: arr[i].high});
                    data_low.push({x: date, y: arr[i].low});
                }
                let chart = new CanvasJS.Chart("chartContainer", {
                    title:{
                        text: a + " => " + b
                    },
                    axisY:[{
                        title: b,
                        lineColor: "#C24642",
                        tickColor: "#C24642",
                        labelFontColor: "#C24642",
                        titleFontColor: "#C24642",
                        suffix: ""
                    }],
                    toolTip: {
                        shared: true
                    },
                    legend: {
                        cursor: "pointer",
                        itemclick: function(e) {
                            if (typeof (e.dataSeries.visible) === "undefined" || e.dataSeries.visible) {
                                e.dataSeries.visible = false;
                            } else {
                                e.dataSeries.visible = true;
                            }
                            e.chart.render();
                        }
                    },
                    data: [{
                        type: "line",
                        name: "Open",
                        color: "#369EAD",
                        showInLegend: true,
                        axisYIndex: 1,
                        dataPoints: data_open
                    },
                    {
                        type: "line",
                        name: "Close",
                        color: "#C24642",
                        axisYIndex: 0,
                        showInLegend: true,
                        dataPoints: data_close
                    },
                    {
                        type: "line",
                        name: "Low",
                        color: "blue",
                        axisYIndex: 0,
                        showInLegend: true,
                        dataPoints: data_low
                    },
                    {
                        type: "line",
                        name: "High",
                        color: "#7F6084",
                        axisYType: "secondary",
                        showInLegend: true,
                        dataPoints: data_high
                    }]
                });
                chart.render();
            }
        },
        error: function(request, status, error) {
            logit('Response: ' + request.responseText);
            logit('Error: ' + error );
            logit('Status: ' + status);
            dom.html("");
        },
        complete: function(data) {
            logit(get_text("api_finished", "API Finished") + ": " + api);
        }
    });
}
License
Contribution Welcome
Github: https://github.com/DoctorLai/SteemTools/
- Fork it!
- Create your feature branch: git checkout -b my-new-feature
- Commit your changes: git commit -am ‘Add some feature’
- Push to the branch: git push origin my-new-feature
- Submit a pull request.
Chrome Webstore
Install the CoinTools Now!
–EOF (The Ultimate Computing & Technology Blog) —
824 wordsLast Post: LogoTurtle v0.0.2: ShowTurtle, HideTurtle, Color, Width and Help.
Next Post: Turtle Graphics Programming Update: Adding text, jump, dot, fontsize, download as png