The CPU High Usage (Spikes) may be caused by a few factors: sudden large traffic, incorrect configurations, or slow queries (or bugs in the code). In the following, it shows the CPU spikes on a quad-core server which has 6GB RAM.
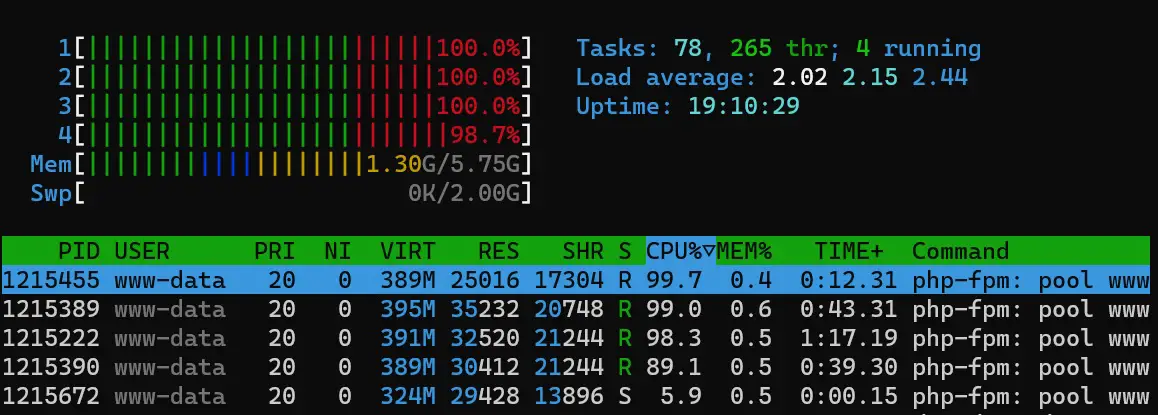
High CPU Usage (shown in htop utility) caused by Slow PHP Queries
How to Enable and Monitor the Slow Logs for PHP-FPM?
PHP-FPM (FastCGI Process Manager) is a popular alternative to the traditional PHP CGI implementation. It provides better performance and more advanced features such as process management, dynamic process spawning, and advanced process monitoring. However, monitoring and debugging PHP-FPM can be challenging, especially when dealing with performance issues.
One of the key tools for troubleshooting performance problems is slow logging. Slow logs record the time it takes for a request to be processed, along with additional information such as the script name, process ID, and request headers. In this post, we will discuss how to enable and monitor slow logs for PHP-FPM.
Step 1: Enable Slow Logs for PHP-FPM
To enable slow logs for PHP-FPM, you need to modify the configuration file for your PHP-FPM pool. The configuration file is usually located in the /etc/php-fpm.d/ directory and has a .conf extension.
Open the PHP-FPM configuration file for your pool using a text editor such as nano or vi. Find the following line:
;slowlog = /var/log/php-fpm/$pool.log.slow
Remove the semicolon at the beginning of the line to uncomment it, and change the path to where you want to store the slow logs. For example:
slowlog = /var/log/php-fpm/www.slow.log
You can also configure the timeout (how long it takes to consider a code slow):
request_slowlog_timeout = 4s
Save the changes to the file and restart PHP-FPM. On most Linux distributions, you can use the following command to restart PHP-FPM:
systemctl restart php-fpm
# or
# service php-fpm restart
Step 2: Monitor Slow Logs for PHP-FPM
Once you have enabled slow logs for PHP-FPM, you can start monitoring them for performance issues. There are several tools you can use to monitor slow logs, including:
Log Files
The simplest way to monitor slow logs is to view them directly in the log file. The slow log file is typically located in the path you specified in the PHP-FPM configuration file. For example, if you set the slow log path to /var/log/php-fpm/www.slow.log, you can view the slow logs using the following command:
tail -f /var/log/php-fpm/www.slow.log
This command will show you the latest entries in the slow log file in real-time. You can use this to monitor the performance of your PHP-FPM pool and identify slow requests.
For example:
[28-Mar-2023 10:59:31]  [pool www] pid 1203612
script_filename = /var/www/steemyy.com/node/index.php
[0x00007fe585a13190] curl_init() /var/www/steemyy.com/node/index.php:51
Log Analysis Tools
If you have a large number of slow logs, it can be difficult to analyze them manually. In this case, you can use log analysis tools to help you identify performance issues. Some popular log analysis tools for PHP-FPM include:
- GoAccess: A real-time web log analyzer that provides a dashboard view of your web server logs. It supports multiple log formats, including Apache, Nginx, and PHP-FPM.
- Logwatch: A log analysis tool that can be used to monitor system logs and send alerts for specified events. It supports multiple log formats, including PHP-FPM.
- AWStats: A web analytics tool that provides detailed statistics about website traffic. It supports multiple log formats, including Apache and Nginx.
Performance Monitoring Tools
In addition to slow logs, you can also use performance monitoring tools to monitor the performance of your PHP-FPM pool. These tools provide real-time metrics about CPU usage, memory usage, and other performance indicators. Some popular performance monitoring tools for PHP-FPM include:
- New Relic: A performance monitoring tool that provides real-time metrics about application performance. It supports multiple programming languages, including PHP.
- AppDynamics: A performance monitoring tool that provides real-time metrics about application performance. It supports multiple programming languages, including PHP.
- Datadog: A cloud-based monitoring and analytics platform that provides real-time metrics about application performance. It supports multiple programming languages, including PHP.
These performance monitoring tools can help you identify performance bottlenecks and optimize your PHP-FPM pool for better performance.
Alerting and Notification Tools
In addition to monitoring performance, you can also set up alerting and notification tools to notify you when there are performance issues. For example, you can set up an alert to notify you when the average response time of your PHP-FPM pool exceeds a certain threshold.
Some popular alerting and notification tools for PHP-FPM include:
- PagerDuty: An incident management platform that provides alerting and notification services. It integrates with many monitoring and alerting tools, including New Relic and Datadog.
- OpsGenie: An incident management platform that provides alerting and notification services. It integrates with many monitoring and alerting tools, including New Relic and Datadog.
- Slack: A messaging platform that provides notification services. You can set up custom alerts using Slack’s API and webhooks.
Conclusion
Enabling and monitoring slow logs for PHP-FPM is an important step in troubleshooting performance issues. By enabling slow logs, you can identify slow requests and optimize your PHP-FPM pool for better performance. There are many tools available for monitoring slow logs, including log files, log analysis tools, performance monitoring tools, and alerting and notification tools. By using these tools, you can ensure that your PHP-FPM pool is performing at its best and delivering fast, responsive web applications.
–EOF (The Ultimate Computing & Technology Blog) —
1165 wordsLast Post: Teaching Kids Programming - Split With Minimum Sum (Heap, Priority Queue)
Next Post: How to Exchange Data Between Processes in Linux?