The Matlab is a very sophisticated mathematics tool that can help you analyse, visualize and process data. Almost all researchers rely on this tool and it saves you tons of code to re-invent the wheels because matlab already provides lots of functions/APIs.
Matlab quiver3 plot 3D line vectors
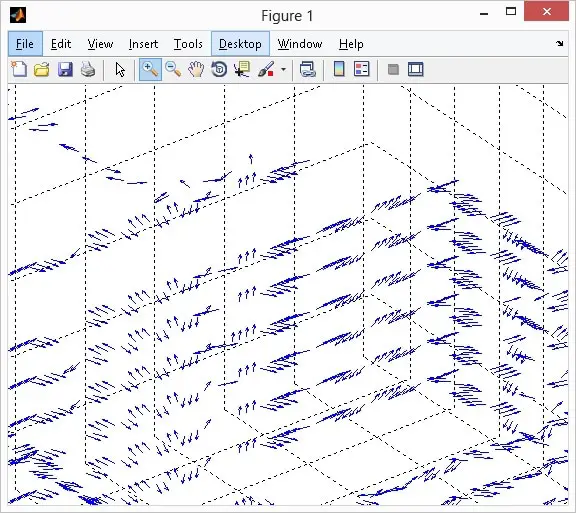
Suppose, you have quite a lot of rays (a 3D fixed point with a direction vector). It is difficult to spot any errors just by looking at the numbers. In this case, you can use the command quiver3 in Matlab to visualize the rays in 3D.
The quiver3 takes 6 parameters, x, y, z and u, v, w. The x,y,z is the 3D point coordinate while the u,v,w is the 3D direction vector. All parameters should be of the same dimensions and the function returns the handle of all line vectors.
Mathworks Matlab
- Draw a Pumpkin using Matlab
- How to Import/Export Matlab *.mat file to Python?
- How to Plot 3D Line Vectors in Matlab Using quiver3?
- The bitand in Matlab
–EOF (The Ultimate Computing & Technology Blog) —
229 wordsLast Post: How to Test Upload/Download Speed of Your Web Server?
Next Post: How to Create a ShortCut using Scripting on Windows ?