The URL: https://helloacm.com/archives-of-pagesposts/ shows the list of historical posts and I have added a following nice figure that plots the number of posts for each month.
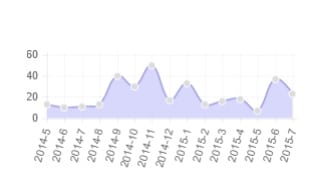
chart-posts-per-months-wordpress-php-js
You can see a rough activity through out the past 12 months. Yes, we get lazy sometime throughout the year. This post shows how to create such a page to get the posts, and the following code can be added in the same page to plot the graph.
We need to include a third party Chart javascript library which can be found at: https://helloacm.com/js/chart.js
  echo '<script language="Javascript" src="https://helloacm.com/js/chart.js"></script>'."\n";
  global $wpdb; // helloacm.com

  // count the posts number group by each month
  $query = "
      select
        concat(year(`post_date`), '-', month(`post_date`)) as `month`,
        count(1) as `cnt`
      from
        `wp_posts`
      where
        (post_type='page' or post_type='post') and
        `post_status` = 'publish'
      group by
        `month`
      order by
        `post_date` desc
      limit
         12
";  // change this to include more months. the default is 12 months in the past.

  $result = array_reverse($wpdb->get_results($query));// reverse the data to get a normal logic flow
  if ($result) {
?>

<div id='ReportBarChartContainerMonthly'>
    <div id='ReportBarChartComponentMonthly' style='margin: 15px;'>
        <canvas id="myChartMonthly" style='max-width:100%;height:auto'></canvas>
    </div>
</div>

<script language="Javascript">
    var data = {
        labels: [

            <?php
    foreach ($result as $month) {
      echo '"'.$month->month.'", ';
    }
            ?>
        ],
        datasets: [
            {
                label: "Number of Posts",
                fillColor: "rgba(200,200,250,0.7)",
                strokeColor: "rgba(150,150,220,1)",
                pointColor: "rgba(220,220,220,1)",
                pointStrokeColor: "#fff",
                pointHighlightFill: "#fff",
                pointHighlightStroke: "rgba(220,220,220,1)",
                data: [
            <?php
    foreach ($result as $month) {
      echo '"'.$month->cnt.'", ';
    }
            ?>
                ]
            }
        ]
    };

    var ctx = document.getElementById("myChartMonthly").getContext("2d");
    var myNewChart = new Chart(ctx).Line(data, {
        bezierCurve: true
    });
</script>
<?php
  }
Save the template file and clear the cache, the plot will be then made alive.
TODO: (1) parameter set to 12 months by default, change that accordingly in the SQL statement (2) array_reverse function in php reverse the output data so that the axis corresponding to the time (from left to the right). (3) change the WordPress table name if it does not start with wp_ prefix.
–EOF (The Ultimate Computing & Technology Blog) —
492 wordsLast Post: Keyboard Review: Corsair Vengeance K65 Compact Performance Mechanical Gaming Keyboard
Next Post: Manage Google Analytics Account in One Place