The company has purchased a 50inch big monitor to display code statistics generated at CI (Continous Integration) server. The data including the number of warnings, the number of unit tests (each developer has his/her own curve), the number of general exceptions, the number of open tasks (occurrences with FIXME/TODO in the code) and etc.
It is also good to have the weekly commitments (as a team) displayed (in e.g. notepad would be fine) clearly in big fonts so everybody in the team can see from time to time when they pass by. Real time visual management is great, not only for the development team, but also to help the rest of the company understand how you are doing.
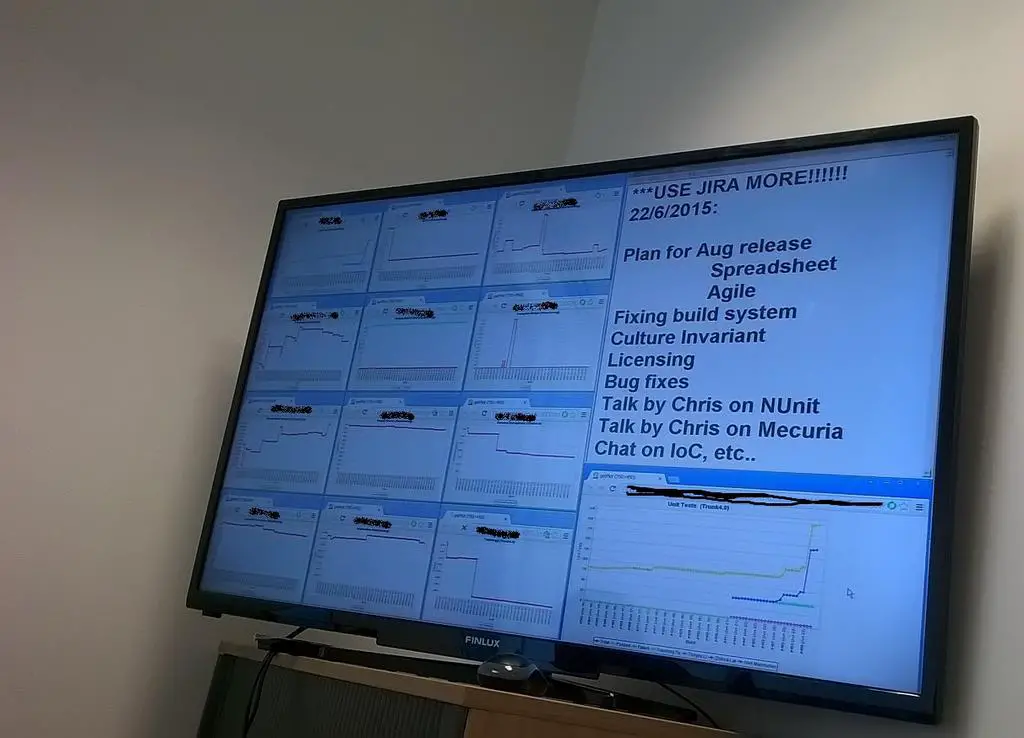
agile-development-big-monitor-ci-server-weekly-commitments
Start agile development asap if you haven’t done so.
–EOF (The Ultimate Computing & Technology Blog) —
226 wordsLast Post: Best Monitors for Programmers
Next Post: The Ultimate VPS from QuickHostUK