The prediction algorithms in the domain of machine learning are all about the probability. The probability is how we represent the likelihood for an event to occur. It is a value between 0 to 1 with 0 meaning NOT going to happen and 1 meaning WILL happen. The numbers closer to 0 represent events less likely to happen while on the opposite, numbers approaching to 1 meaning more likely to happen.
Venn Diagram
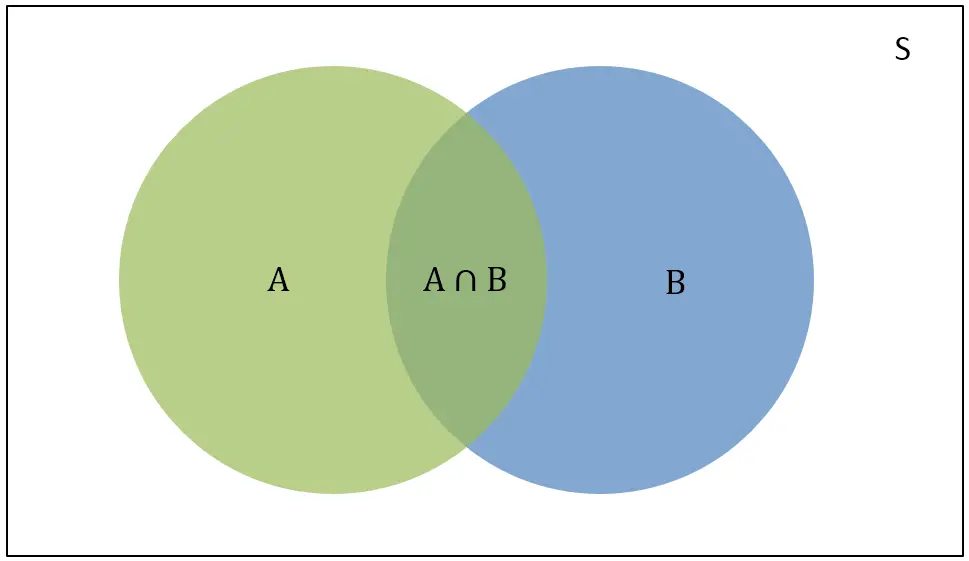
The Venn Diagram (see below), is the vivid representation of the probability.
Venn-Diagram
- S is the sum of the total events in the domain.
- P(A): the probability of event A (green)
- P(B): the probability of event B (blue)
 : both A and B occur
- P(A|B): if B happens, the probability of event A
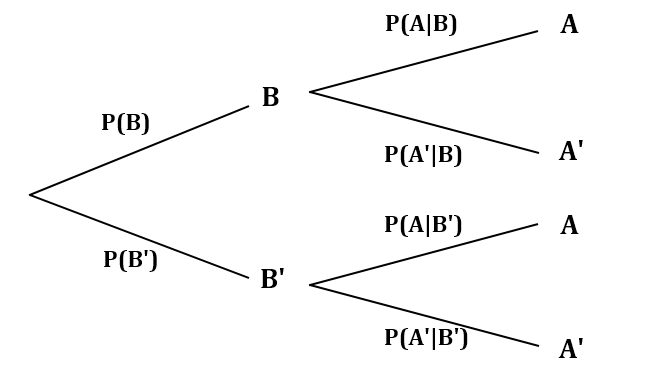
There is another diagram which may express it: the Probability tree.
probability-tree
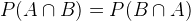
P(A|B) is the likelihood when B already occurs. So it can be also represented by the ratio between probability of both A and B and the event B:
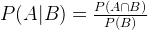
This can also be expressed in the following form, to be integrated in Naive Bayes formula.

Naive Bayes
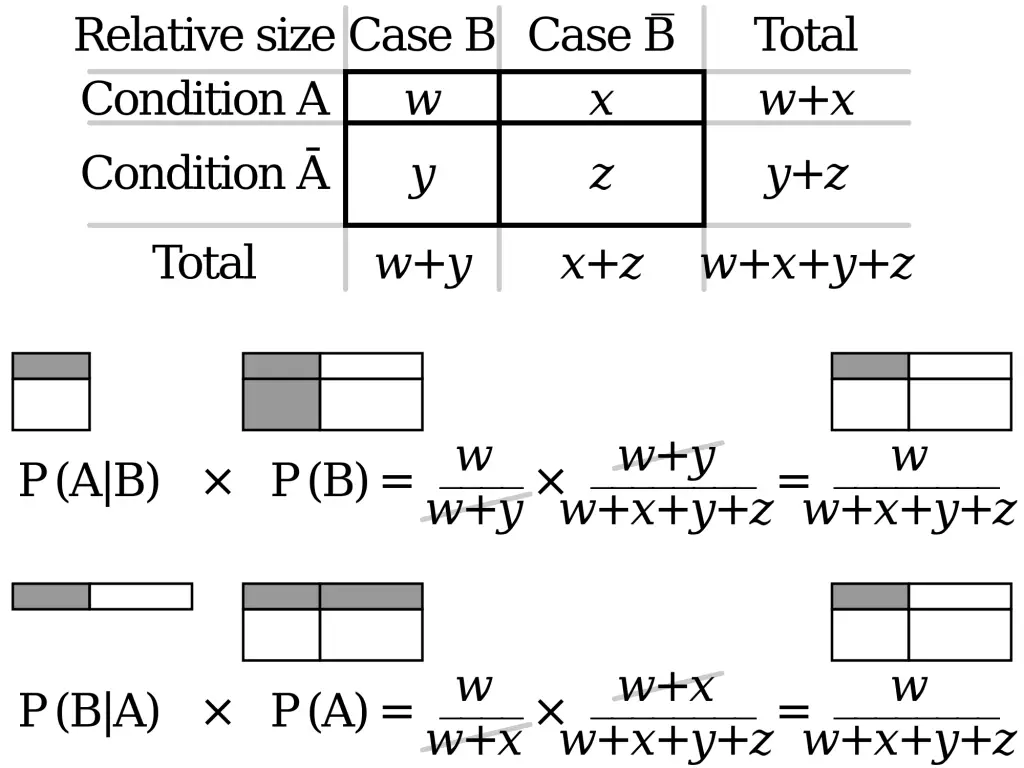
Now comes my favorite formula. The Naive Bayes obtains P(B|A) if we know P(A|B), P(A) and P(B). From the above, similarly, we have:
 .
.
From the probability tree (above), we can transform into the following calculations:
Bayes Theorem
What do we have? It is obvious that:

Therefore, we prove that P(B|A) can be computed if we know P(A|B), P(B) and P(B). The Naive Bayes defines such relations:
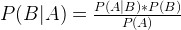
where:
- P(B) is the Prior probability
- P(A) is also the Prior probability and the normalized constant
- P(A|B) is the probability of A when B occurs, also known as the likelihood function
- P(B|A) is the probability of B when A occurs, is the post probability (the value we ask for)
- P(A|B)/P(A) is the standardised likelihood
naive-bayes
with the P(A|B)/P(A), we can further interpret:
- Larger than 1: the probability of the event is larger than the event that has already occurred.
- Smaller than 1: the probability of the event is smaller than the event that has already occurred.
- Equal to 1: the probability of the event is the same as the event that has already occurred.
Case Study via MySQL
We can use Naive Bayes to make predictions based on the given data. For example, given the following MySQL table:
mysql> select * from apple;
+-------+--------+-------+
| color | weight | sweet |
+-------+--------+-------+
|     3 |      4 |     1 |
|     2 |      3 |     1 |
|     0 |      3 |     0 |
|     3 |      2 |     0 |
|     1 |      4 |     0 |
+-------+--------+-------+
5 rows in set (0.00 sec)
sweet=1 means the apple is sweet and 0 otherwise. If we want to predict whether (color = 3, weight = 3) is sweet or not, we can compute each probability (sweet or not) and compare their probability:
P(sweet=1) is the probability of apples being sweet in all instances, we can the following SQL (via nested SQL statements) to obtain such value:
mysql> select x/y from (select count(1) as x from apple where sweet=1) as T1, (select count(1) as y from apple) as T2;
+--------+
| x/y    |
+--------+
| 0.4000 |
+--------+
1 row in set (0.00 sec)
P(color=3|sweet) is the probability of sweet apples that have color=3.
mysql> select x/y from (select count(1) as x from apple where sweet=1 and weight=3) as T1, (select count(1) as y from apple where weight=3) as T2;
+--------+
| x/y    |
+--------+
| 0.5000 |
+--------+
1 row in set (0.00 sec)
Similarly, P(weight=3|sweet) can be computed via SQL:
mysql> select x/y from (select count(1) as x from apple where sweet=1 and weight=3) as T1, (select count(1) as y from apple where sweet=1) as T2;
+--------+
| x/y    |
+--------+
| 0.5000 |
+--------+
1 row in set (0.00 sec)
Therefore, the probability of color=3,weight=3 apple being sweet is 0.4*0.5*0.5=0.1. Next, we need to compute the probability of this apple being (NOT sweet):
P(plain) = 0.6
mysql> select x/y from (select count(1) as x from apple where sweet=0) as T1, (select count(1) as y from apple) as T2;
+--------+
| x/y    |
+--------+
| 0.6000 |
+--------+
1 row in set (0.00 sec)
P(color=3|plain) = 0.3333
mysql> select x/y from (select count(1) as x from apple where sweet=0 and color=3) as T1, (select count(1) as y from apple where sweet=0) as T2;
+--------+
| x/y    |
+--------+
| 0.3333 |
+--------+
1 row in set (0.00 sec)
P(weight=3|plain) = 0.3333
mysql> select x/y from (select count(1) as x from apple where sweet=0 and weight=3) as T1, (select count(1) as y from apple where sweet=0) as T2;
+--------+
| x/y    |
+--------+
| 0.3333 |
+--------+
1 row in set (0.00 sec)
Therefore, the probability of this apple being NOT sweet is 0.6*0.3333*0.3333=0.06666 smaller than 0.1, therefore, this apple is likely to be sweet.
–EOF (The Ultimate Computing & Technology Blog) —
1403 wordsLast Post: C/C++ Linear Regression Tutorial Using Gradient Descent
Next Post: How to Make SQL Insert Statement Simply Faster?