The Scatter Plot is often used to show vivid relations between two variables. Plotting is made very simple and easy in Python using numpy and matplotlib.pylab package.
To demonstrate, we create two random vectors of same size, x and y.
import numpy as np
x=np.random.rand(100)
y=np.random.rand(100)
Then we can plot it:
import matplotlib.pylab as plt
plt.scatter(x, y, s=20, c='g', marker='o')
The first two parameters are mandatory while the rest are optional. The parameter s specifies the marker size and the c gives the color of the marker while the last parameter gives the marker style.
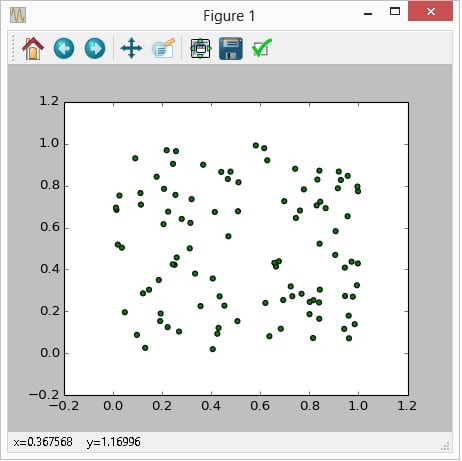
Plot scatter in Python Numpy
–EOF (The Ultimate Computing & Technology Blog) —
189 wordsLast Post: How to Extract Multiple Columns from NumPy 2D Matrix?
Next Post: How to Delete Trash File from Your Windows System using Batch Script?
您会的语言可真多!
:)不多不多, 平时也就做个笔记。