If you are a project leader or even a HR, you might want to know long term that each developer’s activity trend, e.g. when is he/she taking a holiday? or is everybody working as expected? You can build the graphs easily for the trends of committing history (statistics) per developer on the Continuous Integration Server.
Using the following command to obtain a commit log history in XML format, and grepping only the line of the author and then strip out the additional XML tag.
svn log -v --xml | grep "author.*/author"
Then, using Powershell as the build script, to count the number of commits (appearance) for each develop, stored in a dictionary object. Save the numbers per developer in each separate text file, which is to be read by the Jenkins Plot plugin.
<#
.DESCRIPTION
Count SVN Commits
#>

Task SVNLog {
    Set-Location "$WorkingCopyDir"
    $log = &svn log -v --xml | grep "author.*/author"
    $dict = @{}
    $logarr = $log -replace "<author>", "" -replace "</author>", " ".Trim().Split(" ") | ForEach-Object {
        $author = $_.Trim()
        if ($author.Length -gt 2) {
            if ($dict.ContainsKey($author)) {
                $cur = $dict[$author]
                $dict[$author] = $cur + 1
            } else {
                $dict[$author] = 1
            }
        }
    }
    Write-Host "***********************************Commits Statistics************************************"
    $dict.GetEnumerator() | Sort-Object Value -descending

    $total = 0

    foreach ($author in $dict.GetEnumerator()) {
        if ($author.Key -ne $null -and $author.Value -ne $null) {
            $file = $author.Key + ".svn.txt"
            Write-Host $file
            $filename = Join-Path "$SolutionDir" "$file"
            Write-Host $filename
            $total = $total + [convert]::ToInt32($author.Value, 10)
            Write-Host "$total"
            WritePropertyFile $filename $author.Value.ToString() "https://helloacm.com"
            Write-Host "$filename has been written."
        }
    }

    Write-Host "******TOTAL SVN COMMITS = $total ***********************"
    $filename = Join-Path "$SolutionDir" "svn.total.txt"
    WritePropertyFile $filename $total.ToString() "https://helloacm.com"
    Write-Host "$filename has been written."
}
If your CI server has build frequency set to one time per day, then in the long term, you can see the trends for each developer e.g. which seasons are the busiest and which tend to be the holidays.
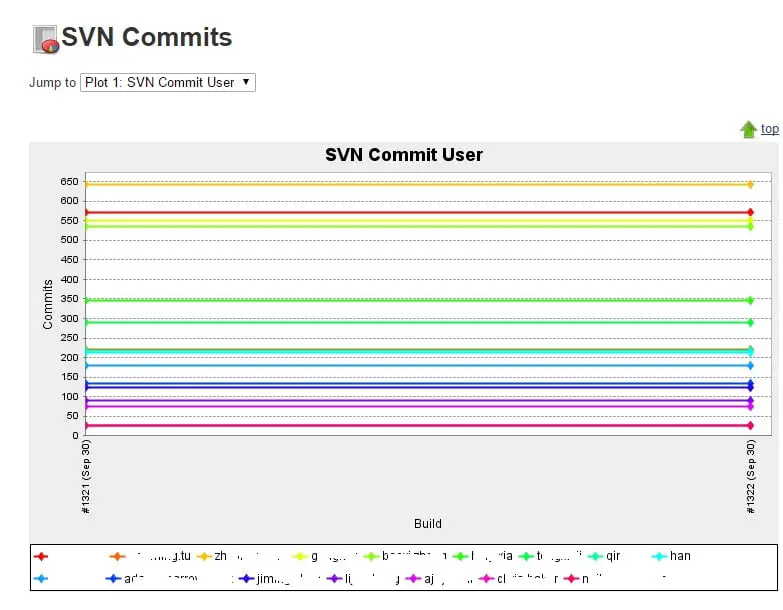
svn-plot-ci-server
–EOF (The Ultimate Computing & Technology Blog) —
406 wordsLast Post: Quickhost UK - 1 Gigz Network Speed Upgrade for VPS
Next Post: QuickhostUK - New VPS Upgrades Available - Continuous Data Protection (CDP)