
R-studio
It is useful to know when a whale votes normally during a day so that you could publish your post right at a time when the whale has a higher voting power. With STEEMSQL and R, this becomes so much easy.
For example, I want to know when my best friend @tumutanzi upvotes with his amazing steem power delegated from @ned , we need this STEEMSQL:
select DATEPART(hour, timestamp) "hour", count(1) "count" from TxVotes where voter='tumutanzi' and datediff(day, timestamp, GetUTCDate()) between 0 and 30 group by DATEPART(hour, timestamp)
between 0 and 30 means we are extracting data for the last 30 days. And we group the results by DATEPART(hour, timestamp) which is the hour in UTC time zone.
Now, we wrap this in the R function, like what we did before:
votes_hour = function(id) {
  conn <- odbcDriverConnect("Driver=SQL Server Native Client 11.0;Server=sql.steemsql.com;Database=DBSteem;Uid=steemit;Pwd=steemit")
  x <- sqlQuery(conn, str_c("select DATEPART(hour, timestamp) hour, count(1) count from TxVotes where voter='", id, "' and datediff(day, timestamp, GetUTCDate()) between 0 and 30 group by DATEPART(hour, timestamp)"))
  close(conn)
  return(x)
}
Here is how we use this function by passing the Steem ID.
id = "tumutanzi"
vote <- votes_hour(id)
Let’s examine the data:
   hour count
1     1     1
2     2     5
3     3     4
4     4     7
5     5    50
6     6    74
7     7    37
8     8    77
9     9   237
10   10   136
11   11    71
12   12    53
13   13    96
14   14   223
15   15   177
16   16   220
17   17   276
18   18   297
19   19   240
20   20   494
21   21   207
22   22   176
23   23    41
OK, if we want to compute the percentage, we just need to sum up the total count and then divide each count:
total = sum(vote$count)
vote$count = vote$count / total * 100
We also need to use the plot_ly from plotly library if we want to visualize the result via the Bar Plot:
plot_ly(x=vote$hour, y=vote$count, type="bar") %>%
  layout(autosize = F, xaxis=list(title="Hour"), yaxis=list(title="Percentage"), title=str_c("@", id))
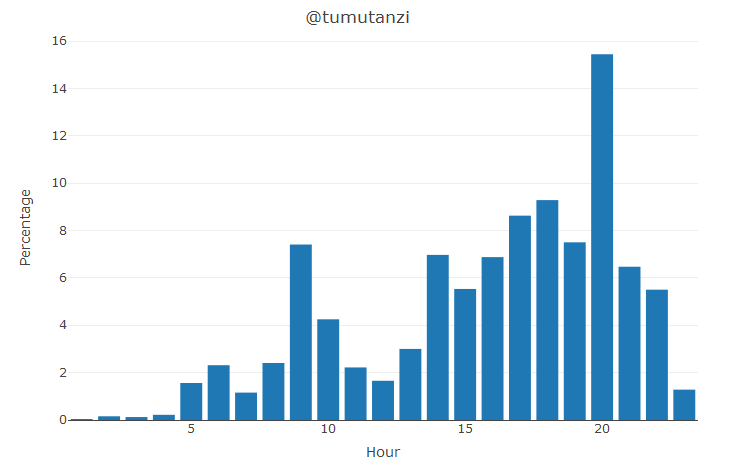
R-plot-hour-voting
Thanks @tumutanzi as he spends most of his afternoons and evenings upvoting good posts.
R Tutorial
- R Tutorial – Map, Filter, Reduce, Lambda
- R Tutorial – Monte Carlo
- R Tutorial – Permutation
- R Tutorial – Sigmoid
- R Tutorial – Connecting to STEEMSQL via RODBC
- R Tutorial – How rich is SteemIt Wechat Group?
- R Tutorial – Knowing when a Steem Whale vote?
- R Tutorial – How to Connect to SteemSQL via RStudio?
- R Tutorial – Using R to Fit Linear Model – Predit Weight over Height
You may also like: R 教程之 STEEMIT 大鲸啥时候点赞的?
–EOF (The Ultimate Computing & Technology Blog) —
617 wordsLast Post: R Tutorial - How rich is SteemIt Wechat Group?
Next Post: Best Upvoting Strategy - SteemIt Voting Power Matters?