The R programming language is designed for statistic computing, and has drawn much attentions due to the emerging interests of Big Data, Data Mining and Machine Learning. It is very similar to Matlab and Python, which has a interactive shell where you type in commands to execute or expressions to evaluate (like a intermediate calculator). You can also save the scripts in *.R script files.
R is best for statistics computation, and it is free, very lightweight (the install package is smaller than 70MB). It can be run on multi platforms e.g. MAC, windows, or linux. This tutorial will guide you through the very quick example of plotting a Sigmoid function using R.
The Sigmoid function in mathematics is defined as:
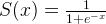
and we can define a function in R.
sigmoid = function(x) {
   1 / (1 + exp(-x))
}
That is it! Like powershell, the last expression is the return value of the function (there is no return keyword like C/C++!) and you don’t need to explicitly define the parameter type. Now, let’s make input x a discrete vector that have values separated by step 0.01 between -5 to 5.
# you can use the equal sign as well, the programmer way.
x <- seq(-5, 5, 0.01)
It is easy to understand that the parameters for seq function is start, stop and step. What x contains now is:
 [1] -5.00 -4.99 -4.98 -4.97 -4.96 -4.95 -4.94 -4.93 -4.92 -4.91 -4.90 -4.89
  [13] -4.88 -4.87 -4.86 -4.85 -4.84 -4.83 -4.82 -4.81 -4.80 -4.79 -4.78 -4.77
  [25] -4.76 -4.75 -4.74 -4.73 -4.72 -4.71 -4.70 -4.69 -4.68 -4.67 -4.66 -4.65
  [37] -4.64 -4.63 -4.62 -4.61 -4.60 -4.59 -4.58 -4.57 -4.56 -4.55 -4.54 -4.53
  [49] -4.52 -4.51 -4.50 -4.49 -4.48 -4.47 -4.46 -4.45 -4.44 -4.43 -4.42 -4.41
...
...
 [985]  4.84  4.85  4.86  4.87  4.88  4.89  4.90  4.91  4.92  4.93  4.94  4.95
 [997]  4.96  4.97  4.98  4.99  5.00
Now, you can just plot it (very similar to the plot function in Python and Matlab).
plot(x, sigmoid(x), col='blue')
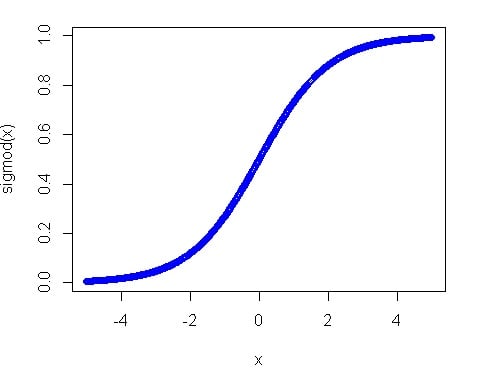
sigmod-function-r
The Sigmoid function is also known as the S function (it has shape of S). The function can be used to map values to (0, 1) so the input can be from negative infinity to infinity. The Sigmoid function is used in the Logistic Regression.
R Tutorial
- R Tutorial – Map, Filter, Reduce, Lambda
- R Tutorial – Monte Carlo
- R Tutorial – Permutation
- R Tutorial – Sigmoid
- R Tutorial – Connecting to STEEMSQL via RODBC
- R Tutorial – How rich is SteemIt Wechat Group?
- R Tutorial – Knowing when a Steem Whale vote?
- R Tutorial – How to Connect to SteemSQL via RStudio?
- R Tutorial – Using R to Fit Linear Model – Predit Weight over Height
–EOF (The Ultimate Computing & Technology Blog) —
667 wordsLast Post: How to Make SQL Insert Statement Simply Faster?
Next Post: How to Add To Favorite using Javascript?
Thanks–the right code snippet at the right time!