In last tutorial, we learn the basics of R programming by the simple example to plot the sigmoid function. This tutorial will continue to help you understand how powerful R is to handle the vectors (arrays).
We know that the math constant  can be approximated by 4 times of the number of points inside a 1/4 circle divided by the total number of points. This is known as the Monte Carlo computation, which is to create as many random sample points as possible and count the statistics.
We can set the random seed by using set.seed() function (you can set to a constant number in order to reproduce the same ‘random’ data sets), e.g.:
set.seed(0.234234)
Now, we can generate two vectors given a length, for example:
# both x and y contains now 100000 random numbers
x=runif(100000)
y=runif(100000)
These random numbers are float numbers between 0 and 1, which can be visualized as 100000 points. So we can now compute their distance to the (0, 0), or the radius of the circle.
z=sqrt(x^2+y^2)
Now, z is also length of 100000. We next need to count how many of the distances in z vector are smaller than 1 (falling inside the 1/4 circle). We can use which to return all indices of the array given a condition.
# The following returns the indices vector when z is less than 1
which(z<1)
To count the points, we use the length function. And the PI is finally estimated in a straightforward expression. Remember, this is just the approximation and the accuracy does improve when the number of samples gets larger and larger.
length(which(z<=1))*4/length(z)
[1] 3.1454
Plot the points
We can plot the points (that fall inside the circle) using (default black color if color is not specified):
plot(x[which(z<=1)],y[which(z<=1)],xlab="X",ylab="Y",main="Monte Carlo")
and points outside the circle (noted in blue color) can be added to the same plot using:
points(x[which(z>1)],y[which(z>1)],col='blue')
This finally gives the plot:
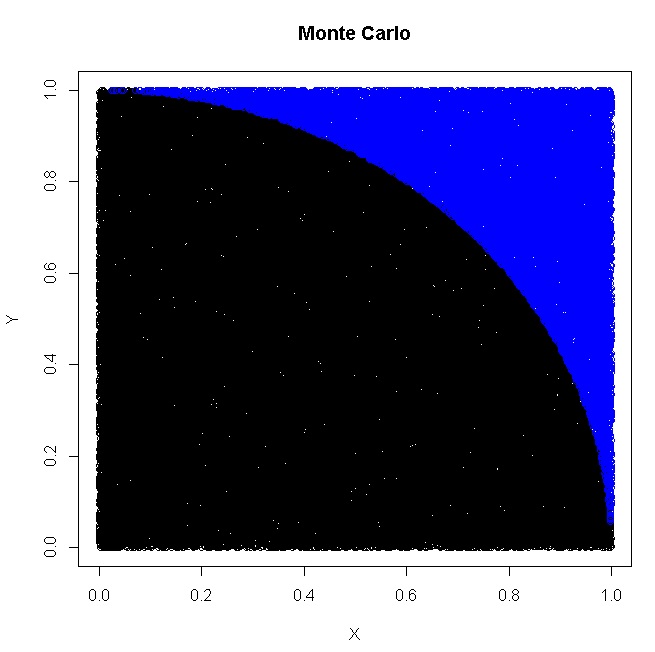
monte-carlo-pi-in-r
You see? No for/while loops, just 4 statements in R!
R Tutorial
- R Tutorial – Map, Filter, Reduce, Lambda
- R Tutorial – Monte Carlo
- R Tutorial – Permutation
- R Tutorial – Sigmoid
- R Tutorial – Connecting to STEEMSQL via RODBC
- R Tutorial – How rich is SteemIt Wechat Group?
- R Tutorial – Knowing when a Steem Whale vote?
- R Tutorial – How to Connect to SteemSQL via RStudio?
- R Tutorial – Using R to Fit Linear Model – Predit Weight over Height
Monte Carlo Simulation Algorithms to compute the Pi based on Randomness:
- Teaching Kids Programming – Area and Circumferences of Circle and Monte Carlo Simulation Algorithm of PI
- Using Parallel For in Java to Compute PI using Monte Carlo Algorithm
- Monte Carlo solution for Mathematics × Programming Competition #7
- R Programming Tutorial – How to Compute PI using Monte Carlo in R?
- C++ Coding Exercise – Parallel For – Monte Carlo PI Calculation
- Area of the Shadow? – The Monte Carlo Solution in VBScript
- VBScript Coding Exercise – Compute PI using Monte Carlo Random Method
- Computing Approximate Value of PI using Monte Carlo in Python
- How does the 8-bit BASIC perform on Famicom Clone – Subor SB2000 – FBasic – Compute PI approximation using Monte-Carlo method
- GoLang: Compute the Math Pi Value via Monte Carlo Simulation
- BASH Script to Compute the Math.PI constant via Monte Carlo Simulation
–EOF (The Ultimate Computing & Technology Blog) —
1028 wordsLast Post: How to Add To Favorite using Javascript?
Next Post: How to Solve 'Mobile Data Disconnected' on HTC One M9?