In last tutorial, we learn the basics of R programming by the simple example to plot the sigmoid function. This tutorial will continue to help you understand how powerful R is to handle the vectors (arrays).
We know that the math constant 

We can set the random seed by using set.seed() function (you can set to a constant number in order to reproduce the same ‘random’ data sets), e.g.:
set.seed(0.234234)
Now, we can generate two vectors given a length, for example:
# both x and y contains now 100000 random numbers
x=runif(100000)
y=runif(100000)
These random numbers are float numbers between 0 and 1, which can be visualized as 100000 points. So we can now compute their distance to the (0, 0), or the radius of the circle.
z=sqrt(x^2+y^2)
Now, z is also length of 100000. We next need to count how many of the distances in z vector are smaller than 1 (falling inside the 1/4 circle). We can use which to return all indices of the array given a condition.
# The following returns the indices vector when z is less than 1
which(z<1)
To count the points, we use the length function. And the PI is finally estimated in a straightforward expression. Remember, this is just the approximation and the accuracy does improve when the number of samples gets larger and larger.
length(which(z<=1))*4/length(z)
[1] 3.1454
Plot the points
We can plot the points (that fall inside the circle) using (default black color if color is not specified):
plot(x[which(z<=1)],y[which(z<=1)],xlab="X",ylab="Y",main="Monte Carlo")
and points outside the circle (noted in blue color) can be added to the same plot using:
points(x[which(z>1)],y[which(z>1)],col='blue')
This finally gives the plot:
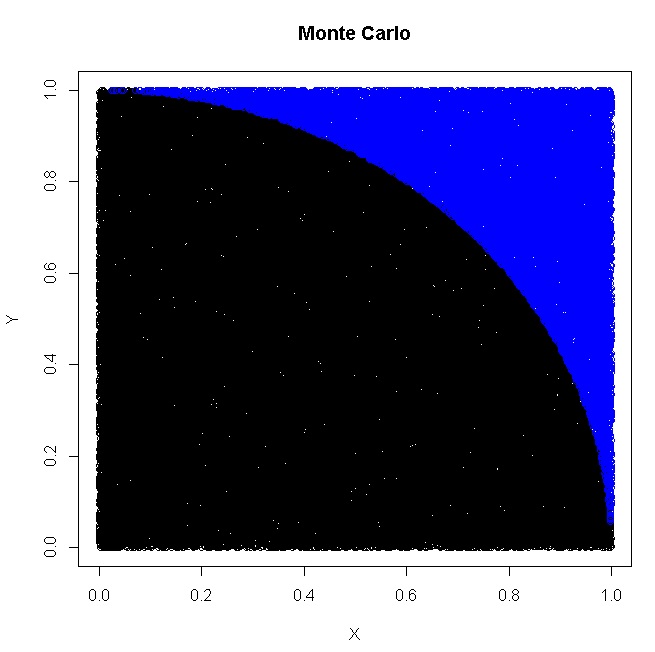
monte-carlo-pi-in-r
You see? No for/while loops, just 4 statements in R!
R Tutorial
- R Tutorial – Map, Filter, Reduce, Lambda
- R Tutorial – Monte Carlo
- R Tutorial – Permutation
- R Tutorial – Sigmoid
- R Tutorial – Connecting to STEEMSQL via RODBC
- R Tutorial – How rich is SteemIt Wechat Group?
- R Tutorial – Knowing when a Steem Whale vote?
- R Tutorial – How to Connect to SteemSQL via RStudio?
- R Tutorial – Using R to Fit Linear Model – Predit Weight over Height
Monte Carlo Simulation Algorithms to compute the Pi based on Randomness:
- Teaching Kids Programming – Area and Circumferences of Circle and Monte Carlo Simulation Algorithm of PI
- Using Parallel For in Java to Compute PI using Monte Carlo Algorithm
- Monte Carlo solution for Mathematics × Programming Competition #7
- R Programming Tutorial – How to Compute PI using Monte Carlo in R?
- C++ Coding Exercise – Parallel For – Monte Carlo PI Calculation
- Area of the Shadow? – The Monte Carlo Solution in VBScript
- VBScript Coding Exercise – Compute PI using Monte Carlo Random Method
- Computing Approximate Value of PI using Monte Carlo in Python
- How does the 8-bit BASIC perform on Famicom Clone – Subor SB2000 – FBasic – Compute PI approximation using Monte-Carlo method
- GoLang: Compute the Math Pi Value via Monte Carlo Simulation
- BASH Script to Compute the Math.PI constant via Monte Carlo Simulation
–EOF (The Ultimate Computing & Technology Blog) —
Last Post: How to Add To Favorite using Javascript?
Next Post: How to Solve 'Mobile Data Disconnected' on HTC One M9?